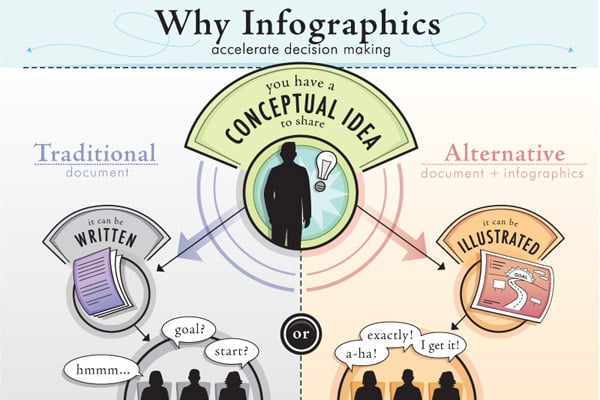
 We have all heard the expression “a picture is worth a thousand words.” And in today’s connected world, images and multimedia are more important than ever in effectively communicating in online spaces. Let’s not forget that infograhics also appeals to visual learners.
What are infographics?
According to visual.ly an infographic is a fancy word for “data visualization.” But don’t get worried all you liberal arts folks out there–the word data can be interpreted in a variety of ways. Visual.ly points out 4 key hallmarks of an infographic:
Visualizations that…
- represent complex information quickly and clearly
- integrate words and graphics to reveal information, patterns or trends
- are easier to understand than words alone
- are beautiful and engaging
Bloom’s Taxonomy & Infographics
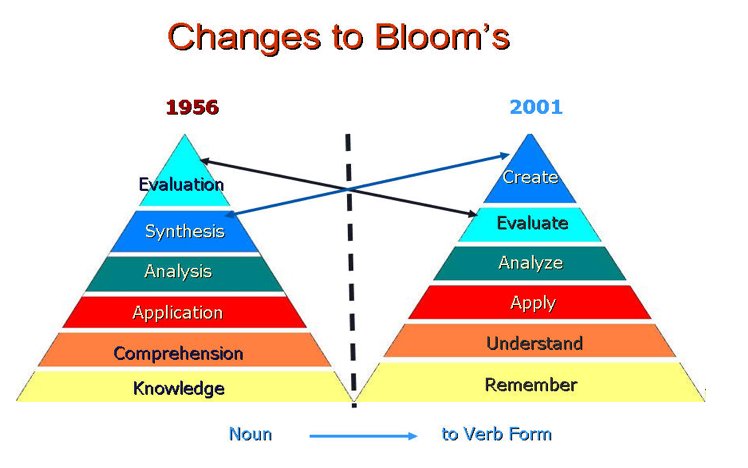
How do infographics support the application of Bloom’s Taxonomy in the classroom? Take a look at this infographic to see how technology has transformed how we think about higher-order thinking and learning. It’s so interesting how the Bloom’s of yesterday used nouns to describe the learning and today we expect action/verbs–we want our students to create, evaluate, analyze, apply, understand and remember. How can infographics support creating, evaluating, analyzing, applyinge, understanding and remembering? (Infographic from NewEd)
David McCandless From Ted Talks (18:17)
This video talks about the power of data visualization. Check it out!
Connected Learning
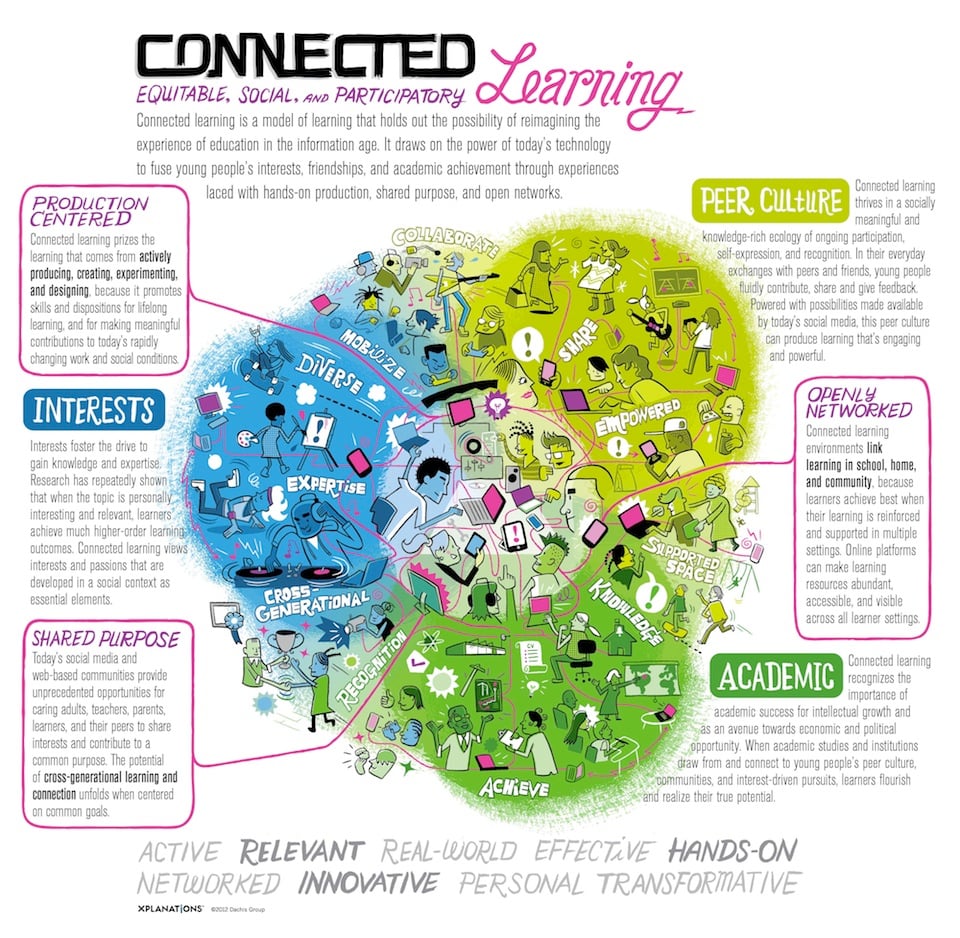
This is my favorite infographic on connected learning (from Connected.tv). It really shows what I love about learning in the digital age and how it can be a transformative experience for students and teachers. What do you think? Does this inforgraphic measure up to visual.ly’s list of requirements?
Resources to Learn More About Infographics:
More Than Words Can Say–Infographics, by Jane Krauss: Wonderful article giving tips, how to’s, samples and more. This is a great place to begin! (ISTE’s Learning & Leading With Technology, February 2012 Vol. 39 No. 5)
Teaching With Infographics | Places to Start (Teaching and Learning With the New York Times Learning Network)
Tools to Create Your Own Infographics:
All the tools listed here are free and do not require you to download or install any software (web-based). My advice for using tools with students is ALWAYS try them out yourself FIRST. (Remember, kids under 13 cannot sign up for a tool [Children’s Online Privacy Protection Act].) Every tool will have something you like and something you don’t love. Also, consider the idea of saving work and returning to something later. Some tools require you to sign in order to save work and return to it later (example: Gliffy). If you have younger students, you may consider creating the infographic with them collectively at a learning station in the classroom. How else might you create infographics with your students?
Visual.ly -Create, share and get feedback using visual.ly
easel.ly – Very user-friendly, lots of tools for design and some preset themes to get you started
Many Eyes -A tool from IBM; Peruse the gallery to get ideas and then choose your data and the type of visualization you would like to create
Gliffy -Gliffy is great for mindmapping too; Check out the gallery of images and shapes, as well as how to upload your own images to be part of the visualization
Chartle -Make pretty interactive charts and graphs (this runs off of java applets, so you may be prompted to download or update your java)
Digital Challenge #3
It’s your turn! Create an infographic that supports one of your curricular units. Think about choosing a unit of study that is well-established, so that you can focus on the infographic and not the content. If the infographic has a web link from a tool you used, share it on this blog! And, if you are up and running on Twitter, tweet it out to the world!
Also, post your thoughts on infographics in the classroom on this blog–let’s get the dialogue rolling:)


Did you try a tool? Give us a review here! How can you use infographics in your classroom? Please share your thoughts…
These are excellent marketing tools too. Thanks for the resources!
Sarah,
What a grand post on infographics! I’ll be linking to it in any discussion around infographics for learning–
You’ve got a great series going here–
Lani
Hi Sarah,
I played with a new tool! I signed up at Piktochart.com and created a graphic to summarize “The Daily 5.” I just posted it on href= “http://edtechworkshop.blogspot.com/2012/09/daily-5-doings.html”>my blog
I love this as a tool for the classroom. I agree with you that it is no longer enough to be able to communicate with text. Everyone has to have visual literacy. We are all so accustomed to reading visually, but I think there is a lack of ability in many people’s ability to create good visuals. I know I need practice and feedback!
Making the piktochart forced me to choose what I thought were the most important points from the book that I wanted to communicate to my intended audience. What would they understand and what did I need to define in greater detail?
my link didn’t come out right. It’s -http://edtechworkshop.blogspot.com/2012/09/daily-5-doings.html
Andrea,
Thanks for the feedback on my post for Infographics and for sharing your beautiful inforgraphic on “The Daily 5.” It is easy to follow, gives a clear picture of literacy in today’s world, including purpose + choice = motivation. Do you mind if I tweet this out to some folks? http://edtechworkshop.blogspot.com/2012/09/daily-5-doings.html
Looking forward to collaborating with you in the future:)